How Does the Ocean Food Web Work? — From Plankton to Sharks and Back Again
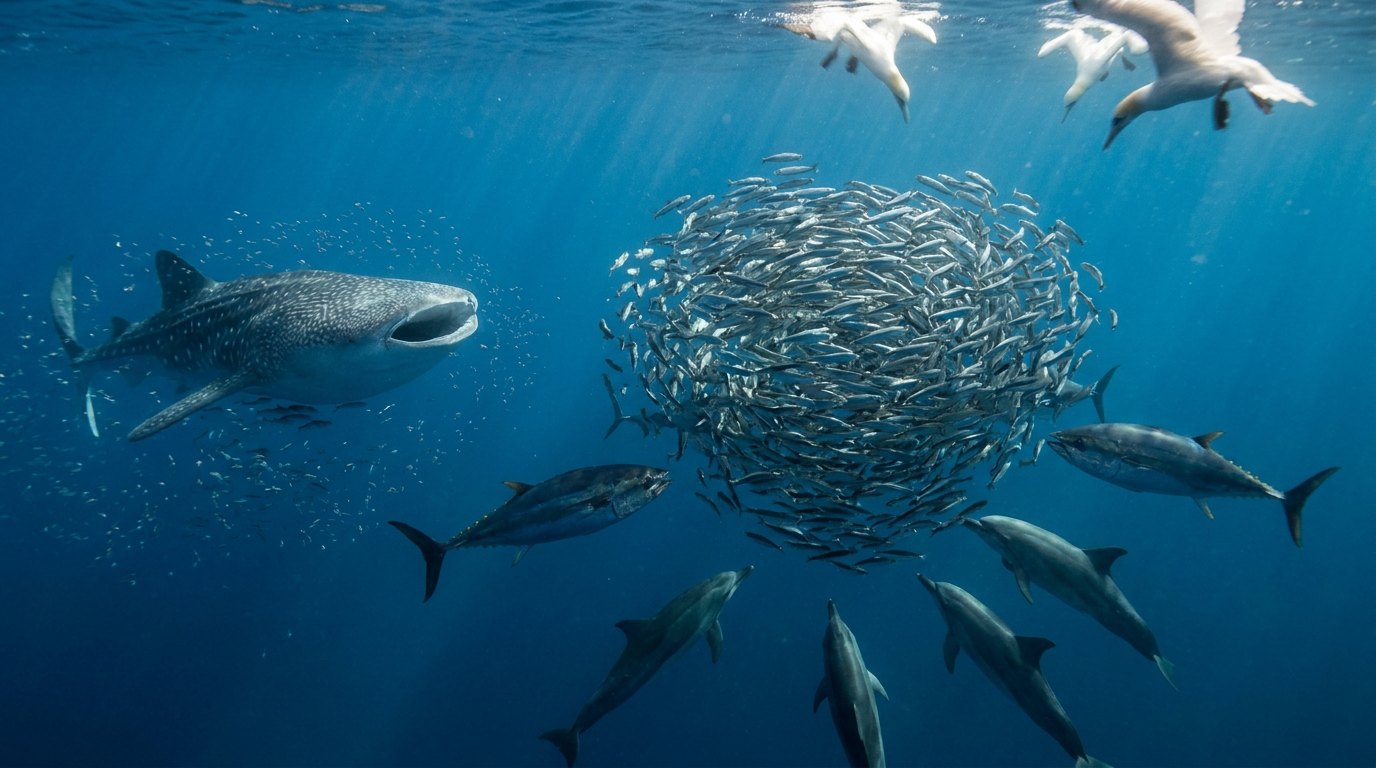
The ocean food web is built on phytoplankton, microscopic algae and bacteria that capture sunlight and produce roughly half of the world’s photosynthetic output. Energy passes up through zooplankton, small fish and squid, larger fish and seabirds, and finally apex predators such as orcas and large sharks. At each step only about 10% of the energy is passed on, and decomposers recycle nutrients back to the base.
A food web maps who eats whom in an ecosystem. Unlike a simple food chain, it shows that most animals eat many prey and are eaten by several predators. In the ocean, food webs are often longer than on land because the primary producers are tiny, so energy passes through more steps before reaching large predators.
What are the trophic levels in the ocean?
Each level is defined by what an organism eats.
| Level | Role | Examples |
|---|---|---|
| 1. Primary producers | Make food from sunlight or chemicals | Phytoplankton, seaweed, seagrass, vent bacteria |
| 2. Primary consumers | Eat producers | Copepods, krill, sea urchins, green turtles |
| 3. Secondary consumers | Eat herbivores | Sardines, anchovies, jellyfish, small squid |
| 4. Tertiary consumers | Eat smaller predators | Tuna, seals, dolphins, seabirds |
| 5. Apex predators | Few or no natural predators | Orcas, great white sharks |
| Decomposers | Recycle dead matter | Bacteria, fungi, worms, sea cucumbers |
What are examples of ocean food chains?
A few simple chains show how energy moves through the web.
- Southern Ocean: diatoms → krill → blue whale (a very short, efficient chain)
- Open ocean: phytoplankton → copepods → anchovies → tuna → mako shark
- Kelp forest: kelp → sea urchins → sea otters → orcas
- Deep sea: marine snow → amphipods → squid → sperm whale
- Coral reef: algae → parrotfish → grouper → reef shark
Filter feeders like baleen whales and whale sharks skip levels by eating plankton directly, which is why the largest animals on Earth can be sustained. See coral reef food web.
Why do decomposers matter in the ocean food web?
They release nutrients locked in dead organisms and waste so producers can use them again.
Bacteria break down most organic matter, while scavengers and detritivores such as sea cucumbers, hagfish and amphipods process carcasses and sediment. Sinking particles called marine snow feed the deep sea, and whale falls create oases for decades. See what is an ocean decomposer.
What is a trophic cascade?
A chain reaction in which changing the number of predators affects every level below.
The classic example is the sea otter: where otters were hunted out, sea urchins exploded and grazed kelp forests into barrens; when otters returned, kelp recovered. Overfishing of sharks and large fish can similarly ripple through food webs. See sea urchins eating kelp.
How do humans affect ocean food webs?
By removing large predators, adding pollutants and changing temperatures.
Overfishing tends to remove large fish first, so catches shift toward smaller species lower in the web, a pattern called “fishing down the food web”. Mercury and other pollutants concentrate up the chain, which is why large tuna and swordfish carry more mercury. Warming and acidification affect plankton and krill at the base. See climate change impacts on the ocean.
Where does the 10 percent rule come from?
The idea that only about a tenth of the energy at one level of a food web reaches the next goes back to a 1942 paper by the American ecologist Raymond Lindeman, who studied the flow of energy through a small lake in Minnesota. He showed that each step in a food chain loses most of its energy to respiration, movement, heat and waste, so that predators can only ever capture a fraction of the energy their prey consumed. The “trophic-dynamic” view he introduced became one of the foundations of modern ecology.
In the ocean, real transfer efficiencies vary widely. Studies of marine ecosystems have found values from a few percent to more than 20 percent, depending on the type of organisms, the temperature and the structure of the food web. A widely cited average for marine systems is about 10 percent, which is why the rule of thumb has stuck. Even small differences matter: in a five-step food chain, an efficiency of 15 percent instead of 10 percent delivers about five times more energy to the top predators.
How much of the ocean’s production ends up as fish?
In 1969 the oceanographer John Ryther published a famous paper in Science comparing the open ocean, coastal waters and upwelling regions. He argued that open-ocean food webs have about five trophic levels, coastal food webs about three, and upwelling food webs only one or two, because in upwelling zones large phytoplankton cells are eaten directly by fish such as anchovies. Because fewer steps mean less energy lost, Ryther estimated that upwelling regions, covering a tiny fraction of the ocean’s surface, produce about half of the world’s fish.
Later work refined his numbers but confirmed the principle. In 1995 Daniel Pauly and Villy Christensen calculated in Nature that global fisheries require about 8 percent of the ocean’s primary production, and a much larger share, roughly a quarter to a third, in upwelling and continental shelf systems. Those figures show how closely fisheries depend on the productivity of the base of the food web, and how quickly heavy fishing can approach its limits.
What is the microbial loop?
For a long time, marine food webs were drawn as simple chains from algae to copepods to fish. In 1983 Farooq Azam and colleagues showed that a large part of the energy fixed by phytoplankton takes a different route. Phytoplankton release dissolved organic matter into the water, and bacteria consume it. Tiny protists eat the bacteria, and larger zooplankton eat the protists, returning some of that energy to the main food web.
This “microbial loop” is now recognised as central to ocean ecology. Bacteria and archaea process a large share of the ocean’s primary production, recycling nutrients that would otherwise be lost. Viruses add another layer: by infecting and bursting microbial cells, they release organic matter back into the water, a process sometimes called the viral shunt. The ocean’s food web is therefore dominated by organisms invisible to the naked eye.
Which organisms are the most important producers?
Phytoplankton are extremely diverse. Diatoms, which build glassy shells of silica, dominate in cool, nutrient-rich waters and are key producers in upwelling regions and the Southern Ocean. Dinoflagellates, many of which can swim with whip-like flagella, include species that cause red tides and others that live inside corals. Coccolithophores cover themselves in tiny plates of calcium carbonate and can form blooms visible from space.
The smallest producers may be the most numerous. Prochlorococcus, a cyanobacterium discovered in 1988 by Sallie Chisholm and colleagues, is so small that it was overlooked for decades, yet it is thought to be the most abundant photosynthetic organism on Earth, with an estimated global population in the order of 10 to the power of 27 cells. Together with its relative Synechococcus, it dominates production in the warm, nutrient-poor open ocean that covers most of the tropics and subtropics.
Why is the ocean’s biomass pyramid upside down?
On land, the mass of plants far exceeds the mass of animals that eat them. In the ocean, the opposite is true. A 2018 census of life on Earth by Yinon Bar-On, Rob Phillips and Ron Milo in the Proceedings of the National Academy of Sciences estimated that marine consumers, including animals and protists, outweigh marine producers several times over.
The explanation is speed. Phytoplankton have very short lives, often dividing once a day, and are eaten almost as fast as they grow. A small standing stock of producers can therefore support a much larger biomass of consumers, as long as it keeps renewing itself. Trees, by contrast, can live for centuries and store huge amounts of carbon in wood that few animals eat. This difference makes ocean food webs fast and dynamic, but also sensitive to any change in the growth of their tiny producers.
What role does the twilight zone play?
Between about 200 and 1,000 metres lies the twilight zone, or mesopelagic, home to lanternfish, bristlemouths, small squid, krill and many other animals. Many of them take part in diel vertical migration: they rise to the surface at night to feed and descend to the depths by day to avoid predators. This is often described as the largest daily migration of animals on Earth.
The twilight zone may contain far more fish than once thought. Acoustic surveys in the 2010s suggested that the biomass of mesopelagic fish could be 10 billion tonnes or more, many times earlier estimates, although the figure is uncertain. These animals link the surface food web to the deep sea, and they carry carbon downward when they feed at the surface and respire or excrete at depth, contributing to the ocean’s biological carbon pump.
How do whales fertilise the ocean?
Large animals can also move nutrients. Whales feed at depth and often release faeces near the surface, where they rest and breathe. Those faecal plumes are rich in nitrogen and iron, nutrients that limit phytoplankton growth in many regions. In a 2010 study in PLoS ONE, Joe Roman and James McCarthy described this process as the “whale pump” and estimated that whales and seals in the Gulf of Maine replenished more nitrogen to surface waters than all the region’s rivers combined.
Whaling removed most of the world’s great whales in the twentieth century, and some researchers argue that this reduced productivity in places such as the Southern Ocean, where iron is scarce. The idea suggests that the recovery of whale populations could help restore ocean productivity, an example of how food webs can work from the top down as well as from the bottom up.
How large is the Antarctic krill population?
Antarctic krill are one of the most important links in any ocean food web. These shrimp-like crustaceans, about 6 cm long, graze on phytoplankton and ice algae and are eaten by whales, seals, penguins, seabirds, fish and squid. A 2009 analysis led by Angus Atkinson estimated their total biomass at about 379 million tonnes, making them one of the most abundant animal species on the planet by mass.
Krill depend on sea ice, which shelters the algae they eat in winter, and their numbers may be affected by warming and by the loss of ice in parts of the Southern Ocean. A growing krill fishery, managed by the Commission for the Conservation of Antarctic Marine Living Resources, harvests krill for aquaculture feed and dietary supplements. Managing that fishery without depriving whales, penguins and seals of food is one of the key challenges of Antarctic conservation.
How do food webs work without sunlight?
In 1977 scientists diving in the submersible Alvin on the Galápagos Rift discovered hydrothermal vents surrounded by giant tube worms, clams and crabs. These communities were not powered by sunlight but by chemosynthesis: bacteria that obtain energy by oxidising hydrogen sulphide and other chemicals in the vent fluids, using it to build organic matter from carbon dioxide.
Some vent animals, such as the giant tube worm Riftia pachyptila, have no mouth or gut. They house chemosynthetic bacteria inside a special organ and absorb the nutrients the bacteria produce. Similar food webs exist at cold seeps, where methane and sulphide leak from the seafloor, and around whale falls. These ecosystems showed that life can thrive without direct energy from the sun.
What is fishing down the food web?
In 1998 Daniel Pauly and colleagues published a paper in Science analysing global fisheries catches since 1950. They found that the average trophic level of the catch was declining, by roughly 0.1 trophic level per decade, as fisheries depleted large predatory fish and turned to smaller species lower in the food web. They called the pattern “fishing down marine food webs”.
The idea sparked debate. Some researchers argued that the trend partly reflected the expansion of fisheries for small species rather than the collapse of large ones, and that catch data do not always reflect what is in the ocean. Nevertheless, there is broad agreement that many populations of large predatory fish have been heavily reduced, and that removing top predators can change the structure of marine food webs in ways that are hard to reverse.
How do pollutants move through food webs?
Some pollutants become more concentrated at each step of a food web, a process called biomagnification. Methylmercury, for example, is absorbed by plankton, retained in their tissues, and passed on to the animals that eat them. Because a predator eats many prey over its life, it accumulates much higher concentrations than any single prey item. Long-lived top predators such as swordfish, sharks, king mackerel and toothed whales therefore have the highest levels.
The most notorious example of the dangers is Minamata Bay in Japan, where industrial mercury discharged in the mid-twentieth century accumulated in fish and shellfish and caused severe neurological disease in people who ate them. Persistent organic pollutants such as PCBs show similar patterns, reaching very high levels in killer whales and some seals. Understanding food webs is therefore essential for public health advice about eating seafood.
How is climate change rewiring ocean food webs?
Warming water changes where species can live, and many fish and plankton are shifting towards the poles or into deeper water. When predators and prey shift at different rates, or when the timing of plankton blooms changes relative to the breeding seasons of fish and seabirds, food webs can be disrupted. Marine heatwaves have caused mass die-offs of seabirds and changes in fish populations in the North Pacific in recent years.
Ocean acidification adds another stress, particularly for organisms that build shells and skeletons from calcium carbonate, such as pteropods, which are important prey for fish. Warmer, more stratified surface waters can also reduce the supply of nutrients from below, potentially lowering productivity in some regions. Because ocean food webs are so interconnected, changes at the base can ripple all the way up to whales and to the fisheries that people depend on.
Plankton fill every role in this web: phytoplankton produce, zooplankton consume and bacterioplankton decompose; see is plankton a producer, consumer or decomposer?
Small toothed whales depend heavily on the forage-fish layer of this web; see what do porpoises eat?
What is the base of the ocean food web?
Phytoplankton, microscopic algae and cyanobacteria that photosynthesise.
What is an example of an ocean food chain?
Phytoplankton → krill → blue whale, or phytoplankton → copepods → anchovies → tuna → shark.
What is at the top of the ocean food web?
Apex predators such as orcas and great white sharks.
What role does krill play?
Krill convert phytoplankton into food for whales, seals, penguins, fish and seabirds, especially in the Southern Ocean.
What are decomposers in the ocean?
Bacteria, fungi and detritivores that break down dead matter and recycle nutrients.
How much energy passes between levels?
Roughly 10% on average, though it varies.
- Field, C. B. et al. (1998). Primary production of the biosphere. Science 281.
- Pauly, D. et al. (1998). Fishing down marine food webs. Science 279.
- Estes, J. A. & Palmisano, J. F. (1974). Sea otters: their role in structuring nearshore communities. Science 185.
- Lindeman, R.L. (1942). The trophic-dynamic aspect of ecology. Ecology 23: 399–417.
- Ryther, J.H. (1969). Photosynthesis and fish production in the sea. Science 166: 72–76.
- Pauly, D. & Christensen, V. (1995). Primary production required to sustain global fisheries. Nature 374: 255–257.
- Azam, F. et al. (1983). The ecological role of water-column microbes in the sea. Marine Ecology Progress Series 10: 257–263.
- Bar-On, Y.M., Phillips, R. & Milo, R. (2018). The biomass distribution on Earth. PNAS 115: 6506–6511.
- Roman, J. & McCarthy, J.J. (2010). The whale pump: marine mammals enhance primary productivity in a coastal basin. PLoS ONE 5: e13255.
- Pauly, D. et al. (1998). Fishing down marine food webs. Science 279: 860–863.
Blane Perun has been exploring Earth’s oceans and marine life for over 25 years. Founder of TheSea.Org in 1999, underwater photographer, coral aquaculture pioneer, and explorer of 80+ countries.
