Better Maps of Mars Than of Our Ocean — Why Seawater Hides the Seafloor From Satellites
It is true: we have far sharper maps of Mars than of Earth’s seafloor. A 2023 Caltech mosaic shows 99.5% of Mars at 5 metres per pixel. By contrast, the international Seabed 2030 project reported in April 2026 that only about 28.7% of the world’s ocean floor has been mapped to modern standards. The rest is known mainly from satellite measurements of the sea surface, which resolve features only a few kilometres across. The reason is simple physics: light and radar cannot pass through kilometres of seawater, so the seafloor has to be mapped by sound, one ship track at a time.
Why do we have better maps of Mars than the ocean?
Because space is transparent and seawater is not. Orbiting cameras and radar can image the whole of Mars, the Moon or Venus from above. On Earth, water absorbs light within a few hundred metres and radar within centimetres, so no satellite can see the seafloor directly. Instead, satellites measure tiny bumps in the sea surface: the gravity of a seamount pulls extra water over it, raising the surface by a few metres. From those bumps, scientists infer the shape of the seafloor, but only for features several kilometres wide. A 2014 review in The Conversation put the resolution of the global satellite-derived map at about 5 km, enough to miss a mountain or a shipwreck entirely.
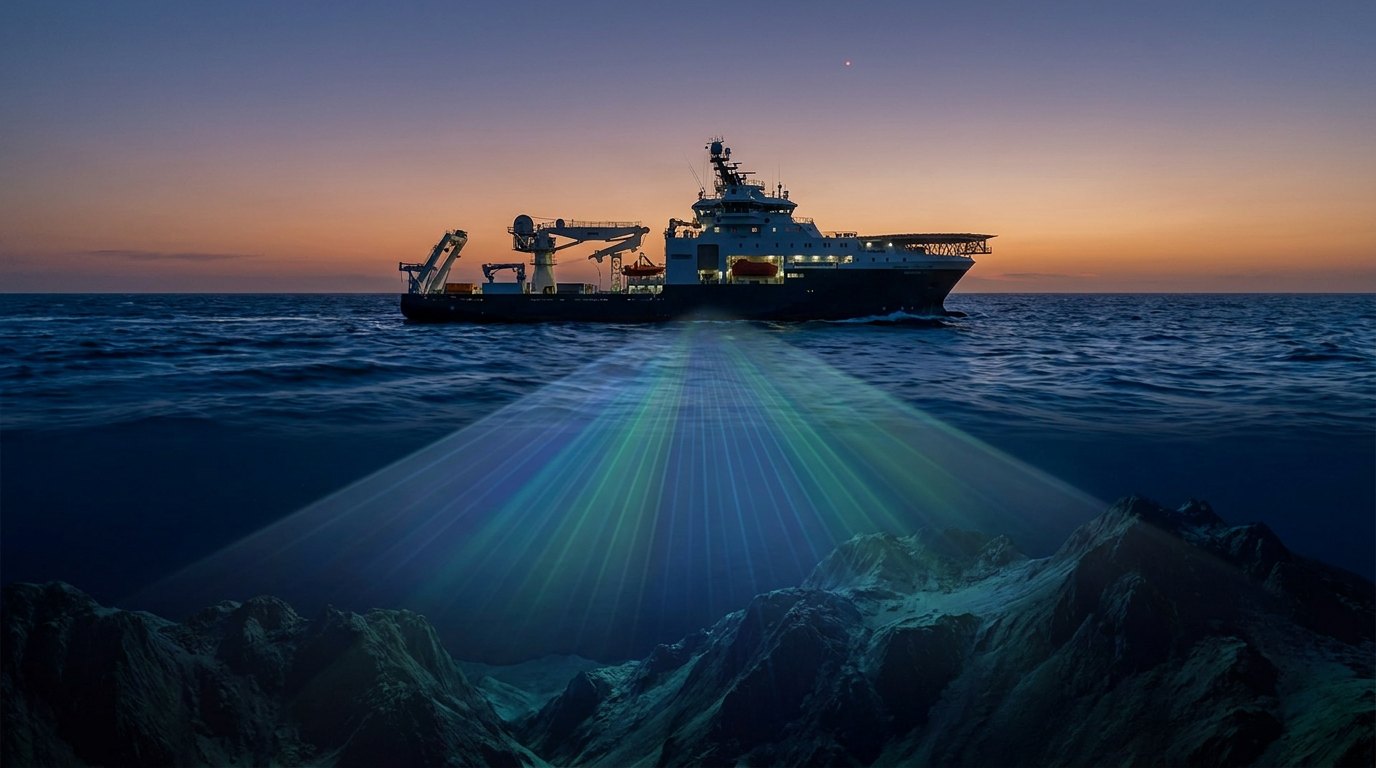
To get real detail you need sound. A ship’s multibeam echo sounder sweeps a fan of sonar pings across the seafloor below it, mapping a strip several times as wide as the water is deep. That is slow work across 361 million km² of ocean. See what oceanographers use echo sounding to study.
How well mapped are Earth’s neighbours?
| Surface | Best global coverage | Source |
|---|---|---|
| Mars | 5 m per pixel, 99.5% of surface | Caltech CTX mosaic, 2023 |
| Moon | ~100 m for the whole surface; some areas ~7 m | The Conversation, 2014 |
| Venus | ~100 m for 98% (radar through clouds) | NASA Magellan |
| Earth’s seafloor | ~5 km by satellite; ~28.7% by modern sonar | Seabed 2030, 2026 |
How much of the ocean floor has been mapped?
The figure is rising quickly. When the Nippon Foundation–GEBCO Seabed 2030 project began in 2017, only about 6% of the seafloor had been mapped to modern standards. By June 2025 the project reported 27.3%, after adding more than four million square kilometres in a single year, and by April 2026 the figure had reached 28.7%. Much of the new data came from governments, research fleets and private companies sharing soundings they already had.
That still leaves about three-quarters of the seafloor known only in blurry outline. Uncharted seamounts still turn up: in 2005 the submarine USS San Francisco ran into an uncharted seamount south-east of Guam at full speed. Poor maps are a navigation hazard, not just a scientific gap.
How are scientists mapping the rest?
- Crowdsourced data: Seabed 2030 collects soundings from fishing boats, cargo ships and yachts.
- Uncrewed surface vessels that run sonar surveys for weeks without a crew.
- Autonomous underwater vehicles that fly close to the bottom for centimetre-scale maps of vents, wrecks and canyons.
- Transit mapping: research ships leave sonar running on every passage instead of only at survey sites.
- New satellite altimetry, such as the SWOT mission launched in 2022, which sharpens the gravity-based map of features too small to see before.
Why does mapping the seafloor matter?
Seafloor maps shape almost everything we do at sea. They predict how tsunamis travel (see how tsunamis form), where fish gather, where cables can be laid and how deep ocean currents move heat around the planet. They also reveal geology: the canyons, trenches and hydrothermal vents where some of the strangest life on Earth lives. Places like Zhemchug Canyon and the Mariana Trench only make sense with a good map.
For divers the gap is personal. Many of the reefs and walls I have dived appear on charts as little more than a depth number and a hazard symbol. The real shape of the bottom is often known only to the people who have swum it.
How was Mars mapped so thoroughly?
Mars has been surveyed by a relay of orbiters for more than a quarter of a century, and none of them had to look through water. NASA’s Mars Global Surveyor reached orbit in September 1997 and carried a laser altimeter, MOLA, that fired ten infrared pulses a second at the ground and timed their return. Before it stopped sending altimetry in June 2001, it had built a precise topographic model of the whole planet, accurate enough to show that the Martian south pole sits higher than the north.
Cameras then filled in the detail. The 5-metre mosaic released by Caltech in 2023 stitches together images from the Context Camera on NASA’s Mars Reconnaissance Orbiter. That spacecraft also carries HiRISE, a telescope camera that can resolve objects less than a metre across from orbit, at about 0.3 metres per pixel. HiRISE shows how the comparison cuts both ways: because its images are so detailed, it had covered only about 1% of Mars by 2010 and around 2.4% by 2016. Even on Mars, the sharpest maps exist only for small patches.
The point of the Mars comparison, then, is not that every Martian pebble is known. It is that any spot on Mars can be looked up at a few metres’ resolution, while most of Earth’s seafloor cannot be resolved to better than a few kilometres. A seamount the size of a small town can still hide in the gaps between ship tracks.
How did people measure ocean depth before sonar?
With a weight on a rope. Records of depth measurement go back more than 3,000 years to ancient Egypt, and for most of history sailors used a lead line, a heavy plumb lowered until it touched bottom, to check depths near coasts. In deep water the method was painfully slow. The British research ship HMS Challenger, whose 1872–1876 voyage founded modern oceanography, carried 291 kilometres of Italian hemp rope for sounding and took 492 deep-sea soundings in more than three years at sea. Its line was flagged every 25 fathoms, so even its best readings were only accurate to about 46 metres.
Sound changed everything. The German inventor Alexander Behm patented an echo sounder in July 1913, and one of the first commercial units, the Fessenden Fathometer, was fitted to a passenger liner in 1924. The principle is simple: sound travels through seawater at roughly 1.5 kilometres per second, so half the time an echo takes to return gives the depth. For precise surveys the speed of sound has to be measured on site, because it changes with temperature, pressure and salinity.
A single-beam sounder only measures the point directly beneath the ship. The multibeam systems now used for modern mapping grew out of US Navy work in the early 1960s, which used a technique called beamforming to pull a whole fan of depth readings from each ping. That is what turned seafloor mapping from a line of dots into a continuous ribbon of terrain.
Who drew the first map of the ocean floor?
The first systematic attempt to map the entire ocean floor came from Marie Tharp and Bruce Heezen at Columbia University’s Lamont Geological Observatory. Tharp, a geologist trained at the University of Michigan, was barred from research ships for much of her career, so Heezen collected echo-sounding data aboard the research vessel Vema while she turned the profiles into maps. In 1952 she lined up six sounding profiles across the North Atlantic and spotted a V-shaped notch running along the crest of the Mid-Atlantic Ridge.
Tharp’s path to that discovery says a lot about the era. Born in Ypsilanti, Michigan, in 1920, the daughter of a government soil surveyor, she attended more than 17 public schools as the family followed her father’s fieldwork. After her master’s degree in 1944 she took a job with an oil company in Tulsa, Oklahoma, that would not let women do fieldwork, and in 1948 she moved to New York and found drafting work with Maurice Ewing, founder of the Lamont observatory. She was not allowed to join a data-collecting cruise until the USNS Kane expedition of 1968, two decades into her mapping career. A submarine mountain range in the mid-Atlantic had been roughly outlined in the nineteenth century, but nobody had drawn its structure in such detail.
She interpreted the notch as a rift valley, where the seafloor was being pulled apart. It reportedly took her about a year to persuade Heezen, because the idea supported continental drift, then a fringe theory. The pair published their first physiographic map of the North Atlantic in 1957, and with the Austrian painter Heinrich Berann they produced The World Ocean Floor, published by National Geographic in 1977. Her work helped bring about the acceptance of plate tectonics. The Cold War added an odd twist: the US government restricted the publication of detailed seafloor maps, fearing they would help Soviet submarines, which is one reason her maps took the form of shaded drawings rather than precise contour charts.
What is GEBCO, and how does Seabed 2030 work?
The global seafloor map has a surprisingly long history. The General Bathymetric Chart of the Oceans, or GEBCO, began in 1903 under the leadership of Prince Albert I of Monaco, and since then it has produced five separate editions of paper charts covering the whole world. Today it is a digital grid run under the joint auspices of the International Hydrographic Organization and UNESCO’s Intergovernmental Oceanographic Commission. Its global grids combine every quality-checked ship sounding available with satellite gravity data, which is used to estimate the shape of the seafloor between survey lines.
Seabed 2030 is the drive to replace those estimates with real measurements. It does not own a fleet. Instead, regional centres gather existing surveys from navies, hydrographic offices, universities, companies and volunteers, then feed them into the GEBCO grid. In April 2026, at the IHO Assembly in Monaco, the project announced that 28.7% of the ocean floor had now been mapped, about 104 million square kilometres, after almost 5 million square kilometres were added in a single year. Some 220 organisations now contribute, including first-time data from Malaysia, Morocco, Papua New Guinea and Saudi Arabia. In the waters around the Arabian Gulf, coverage jumped from about 6.4% to 20.5%.
The progress is real but the target is enormous. On those figures roughly 258 million square kilometres of seafloor remain to be mapped to modern standards, an area larger than all of Earth’s land surface. Finishing by 2030 would mean a pace several times faster than anything achieved so far.
What is waiting in the unmapped areas is not a flat plain. The seafloor holds a mid-ocean ridge system that wraps around the globe, along with undersea volcanoes and seamounts, deep trenches, submarine canyons, broad oceanic plateaus and vast abyssal plains. Each new survey tends to add peaks and valleys that the satellite-based grid had smoothed away, and these features steer deep currents, shape where marine life gathers and decide how tsunami waves bend as they cross an ocean basin. Better maps therefore improve forecasts and fisheries science as well as navigation.
What happens when the map is wrong?
The clearest example is the one mentioned above. On 8 January 2005 the nuclear attack submarine USS San Francisco was running at flank speed at a depth of about 160 metres (525 feet), roughly 675 kilometres south-east of Guam, when it struck an undersea mountain. Its forward ballast tanks and sonar dome were wrecked, 98 crew members were injured and one sailor, Machinist’s Mate Second Class Joseph Allen Ashley, died of his head injuries the next day. The crew fought to regain buoyancy and brought the damaged boat to the surface, reaching Guam on 10 January.
The seamount did not appear on the chart the crew was using, although other available charts marked an area of “discolored water” that hinted at a shallow peak. The Navy concluded that this information should have been transferred to the working chart, particularly in such a poorly surveyed area. A later University of Massachusetts Amherst study added that the charts lacked the latest data simply because that stretch of the Pacific was not a priority for the military mapping agency. Accidents like this are rare, but they show that a coarse global map is not just a scientific problem. Ships, submarines, cable layers, tsunami forecasters and search teams all depend on knowing the shape of the bottom, and in most of the deep ocean that knowledge is still an educated guess.
Can new satellites close the gap?
They can help, but they cannot finish the job. The SWOT mission, built by NASA and the French space agency CNES with Canadian and British partners, uses wide-swath radar altimetry to measure sea surface height across a 120-kilometre band, with readings every 2 kilometres over the deep ocean. It was designed mainly to study rivers, lakes and ocean eddies, and it resolves ocean features of about 15 to 25 kilometres, roughly ten times finer than earlier altimeters. Finer sea-surface data also sharpens the gravity-based picture of the seafloor below. Even so, gravity methods blur detail, so ships and underwater robots carrying sonar will still be needed to see the seafloor at the scale Mars is already mapped.
- Mars is mapped at 5 m per pixel across 99.5% of its surface.
- Only ~28.7% of Earth’s seafloor is mapped by modern sonar (2026).
- Satellites see the seafloor only indirectly, at kilometre scale.
- Seabed 2030 aims to finish the job by 2030.
Why the gap? Part of the answer is money: compare the budgets in ocean exploration vs space exploration. And for what a finished map would give us, see why ocean exploration is important and the work of geological oceanographers, who turn sonar soundings into seafloor maps.
Is it true we know more about Mars than the ocean?
For maps, yes. Mars is imaged at 5 m per pixel across 99.5% of its surface, while only about 28.7% of the seafloor is mapped to modern sonar standards.
What share of the seafloor has been mapped?
About 28.7% to modern standards as of April 2026, according to Seabed 2030 (up from 27.3% in June 2025). The whole floor is mapped coarsely by satellite.
Why can’t satellites map the ocean floor?
Water blocks light and radar. Satellites can only measure the sea surface, whose small bumps reflect the gravity of features below.
How do scientists map the ocean floor?
Mainly with multibeam sonar on ships and underwater robots, which time echoes of sound pulses off the bottom.
What is Seabed 2030?
A joint project of the Nippon Foundation and GEBCO, launched in 2017, aiming to map the entire ocean floor by 2030.
How much of the ocean is explored?
Far less than is mapped. Most of the deep sea has never been seen by human eyes or cameras.
Is the Moon better mapped than the ocean floor?
Yes. The whole lunar surface is mapped at about 100 m resolution, far finer than the satellite-derived seafloor map.
- Caltech (2023), global image of Mars. Mars CTX mosaic.
- Seabed 2030 / Nippon Foundation (June 2025). 27.3% of seafloor mapped.
- International Hydrographic Organization (28 April 2026), “Global seabed mapping reaches new milestone as five million square kilometres added in a year.” 28.7%, 104 million km², 220 contributors.
- Wikipedia, “Marie Tharp,” “GEBCO,” “Echo sounding,” “Multibeam echosounder,” “Challenger expedition,” “USS San Francisco (SSN-711),” “Mars Orbiter Laser Altimeter,” “HiRISE” and “Surface Water and Ocean Topography.”
- The Conversation (2014), “Just how little do we know about the ocean floor?” Map resolutions of Earth and other worlds.
- NOAA Ocean Exploration, seafloor mapping overviews.
Blane Perun has been exploring Earth’s oceans and marine life for over 25 years. Founder of TheSea.Org in 1999, underwater photographer, coral aquaculture pioneer, and explorer of 80+ countries.
About Blane Perun →